AlGaN/GaN HEMT - chemical sensors: Difference between revisions
No edit summary |
No edit summary |
||
| Line 16: | Line 16: | ||
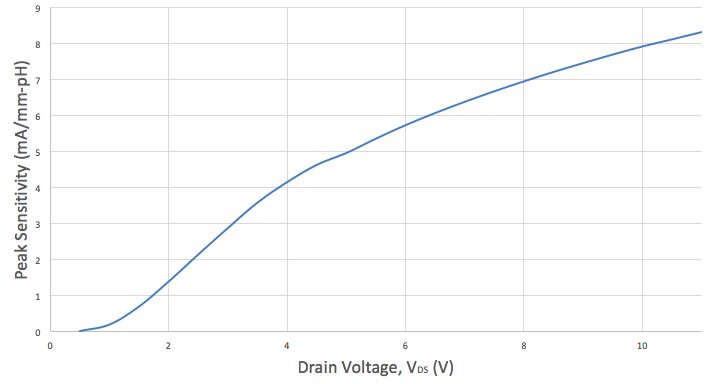
To determine the extent of increased sensitivity with drain bias, figure 2 depicts the peak sensitivity as a function of drain voltage for a 1 m gate length device. The peak sensitivity increases sharply from roughly 1V to 4 V and then shows an increasing trend with a smaller slope indicating a possible saturation point at higher drain voltages. | To determine the extent of increased sensitivity with drain bias, figure 2 depicts the peak sensitivity as a function of drain voltage for a 1 m gate length device. The peak sensitivity increases sharply from roughly 1V to 4 V and then shows an increasing trend with a smaller slope indicating a possible saturation point at higher drain voltages. | ||
[[File:PRiMESubmissionFigure3.png]] | |||
"Figure 3. Simulated results of peak sensitivity (mA/mm-pH) as a function of drain voltage, VDS, for a 1um gate length AlGaN/GaN HEMT pH sensor." | |||
Revision as of 19:36, 13 July 2016
Optimization of GaN-based HEMTs for Chemical Sensing: A Simulation Study
This page provides a brief analysis of trends with parameters such as gate length and drain-to-source voltage with respect to sensitivity for AlGaN/GaN HEMTs pH sensors.
Drain-to-Source Voltage and Sensitivity
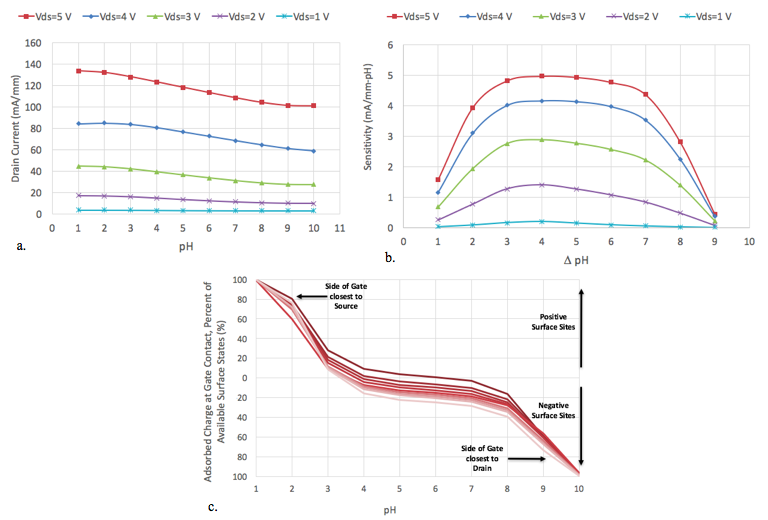
First, sensor linearity and the effect of drain bias is investigated via a simulation study of one device with gate length equal to 1 m. Figure 1a shows the drain current versus pH at drain biases ranging from 1V to 5V. Figure 1b extracts the sensitivity from Figure 1a confirming experimental results showing increased sensitivity with increased drain bias. The influence of drain bias on sensitivity is a useful trend for optimization, however, power requirements must be considered, particularly for in vivo devices. Figure 1c displays the corresponding absorbed charge at the gate for a drain bias of 5 V at specific positions across the gate surface. The family of curves shows the range of adsorbed charge across the gate from the leftmost side to the rightmost side. The much larger changes in interface charge going from pH values 1-3 and 8-10 correspond to smaller sensitivities. The linear region of this simulated device at high drain biases (4-5 V) is roughly from pH values 3 to 8, which corresponds to the linear region of change in interface charge.
Figure 1. a) Drain current versus pH with varied drain bias ranging from 1 V to 5 V with a 1 V increment for a 1um gate length device. b) Corresponding sensitivity versus pH. c) Corresponding percent of available surface charge at the gate contact vs. pH at a drain bias of 5 V. The top signifies positive surface site where the bottom is negative surface sites. Figure 1c is depicted across the gate, whereas Figure 1a and 1b are between the source and drain.
To determine the extent of increased sensitivity with drain bias, figure 2 depicts the peak sensitivity as a function of drain voltage for a 1 m gate length device. The peak sensitivity increases sharply from roughly 1V to 4 V and then shows an increasing trend with a smaller slope indicating a possible saturation point at higher drain voltages.
"Figure 3. Simulated results of peak sensitivity (mA/mm-pH) as a function of drain voltage, VDS, for a 1um gate length AlGaN/GaN HEMT pH sensor."

