File:PRiMESubmissionFigure2.png
Jump to navigation
Jump to search
No higher resolution available.
PRiMESubmissionFigure2.png (768 × 520 pixels, file size: 135 KB, MIME type: image/png)
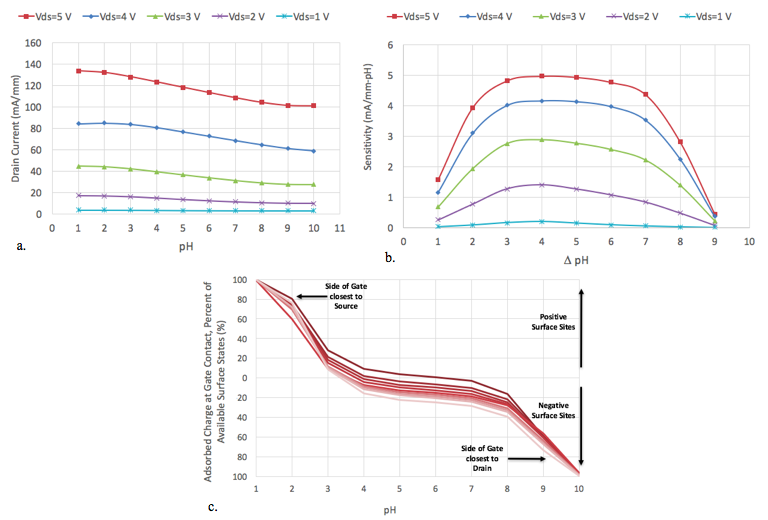
Figure 2. a) Drain current versus pH with varied drain bias ranging from 1 V to 5 V with a 1 V increment for a 1um gate length device. b) Corresponding sensitivity versus pH. c) Corresponding percent of available surface charge at the gate contact vs. pH at a drain bias of 5 V. The top signifies positive surface site where the bottom is negative surface sites. Figure 2c is depicted across the gate, whereas Figure 2a and 2b are between the source and drain.
File history
Click on a date/time to view the file as it appeared at that time.
| Date/Time | Thumbnail | Dimensions | User | Comment | |
|---|---|---|---|---|---|
| current | 19:32, 13 July 2016 | | 768 × 520 (135 KB) | Maddie (talk | contribs) | Figure 2. a) Drain current versus pH with varied drain bias ranging from 1 V to 5 V with a 1 V increment for a 1um gate length device. b) Corresponding sensitivity versus pH. c) Corresponding percent of available surface charge at the gate contact vs. |
You cannot overwrite this file.
File usage
The following page uses this file: