PN diode example (1D): Difference between revisions
No edit summary |
No edit summary |
||
| Line 1: | Line 1: | ||
To compare the numerical results with an analytical solution, the built-in voltage is solved both numerically and analytically in this example. The results are shown at the end. | |||
Define constants | |||
set eps [expr 11.8 * 8.854e-14 / 1.619e-19] | set eps [expr 11.8 * 8.854e-14 / 1.619e-19] | ||
set Emob 200.0; | set Emob 200.0; | ||
set Hmob 100.0; | set Hmob 100.0; | ||
Define Poisson and continuity equations | |||
set eqnP "$eps * grad(DevPsi) + Doping - Elec + Hole" | set eqnP "$eps * grad(DevPsi) + Doping - Elec + Hole" | ||
set eqnE "ddt(Elec) - $Emob * 0.025 * sgrad(Elec, DevPsi/0.025)" | set eqnE "ddt(Elec) - $Emob * 0.025 * sgrad(Elec, DevPsi/0.025)" | ||
set eqnH "ddt(Hole) - $Hmob * 0.025 * sgrad(Hole, -DevPsi/0.025)" | set eqnH "ddt(Hole) - $Hmob * 0.025 * sgrad(Hole, -DevPsi/0.025)" | ||
pdbSetDouble Si DevPsi DampValue 0.025 | pdbSetDouble Si DevPsi DampValue 0.025 | ||
pdbSetDouble Si DevPsi Abs.Error 1.0e-9 | pdbSetDouble Si DevPsi Abs.Error 1.0e-9 | ||
| Line 82: | Line 81: | ||
puts "Hole Flux [contact name=top sol=Hole flux]" | puts "Hole Flux [contact name=top sol=Hole flux]" | ||
Plot the concentration profiles of the initial doping and | Plot the concentration profiles of the initial doping and electrons and holes at equilibrium | ||
sel z=log10(abs(Doping)) | sel z=log10(abs(Doping)) | ||
plot.1d | plot.1d | ||
| Line 90: | Line 89: | ||
plot.1d !cle | plot.1d !cle | ||
initialize array, bias (Vb) and | initialize an array, bias (Vb) and counter (i), and create and new graph window | ||
array set curr {} | array set curr {} | ||
set Vb 0.0 | set Vb 0.0 | ||
| Line 107: | Line 106: | ||
} | } | ||
Get the last few points on the IV curve to use linear extrapolation of the built-in voltage | Get the last few points on the IV curve to use for linear extrapolation of the built-in voltage | ||
set l [list "$Vbias(24)" "$curr(24)" "$Vbias(23)" "$curr(23)" "$Vbias(22)" "$curr(22)" ] | set l [list "$Vbias(24)" "$curr(24)" "$Vbias(23)" "$curr(23)" "$Vbias(22)" "$curr(22)" ] | ||
Revision as of 14:25, 18 August 2010
To compare the numerical results with an analytical solution, the built-in voltage is solved both numerically and analytically in this example. The results are shown at the end.
Define constants
set eps [expr 11.8 * 8.854e-14 / 1.619e-19]
set Emob 200.0;
set Hmob 100.0;
Define Poisson and continuity equations
set eqnP "$eps * grad(DevPsi) + Doping - Elec + Hole"
set eqnE "ddt(Elec) - $Emob * 0.025 * sgrad(Elec, DevPsi/0.025)"
set eqnH "ddt(Hole) - $Hmob * 0.025 * sgrad(Hole, -DevPsi/0.025)"
pdbSetDouble Si DevPsi DampValue 0.025
pdbSetDouble Si DevPsi Abs.Error 1.0e-9
pdbSetString Si DevPsi Equation $eqnP
pdbSetString Si Elec Equation $eqnE
pdbSetDouble Si Elec Abs.Error 1.0e-5
pdbSetString Si Hole Equation $eqnH
pdbSetDouble Si Hole Abs.Error 1.0e-5
pdbSetDouble top Hole Abs.Error 1.0e-8
pdbSetDouble top Elec Abs.Error 1.0e-8
pdbSetDouble top DevPsi Abs.Error 1.0e-6
pdbSetDouble top Hole Rel.Error 1.0e-2
pdbSetDouble top Elec Rel.Error 1.0e-2
pdbSetDouble top DevPsi Rel.Error 1.0e-2
pdbSetDouble top DevPsi Flux.Scale 1.619e-19
pdbSetDouble top Elec Flux.Scale 1.619e-19
pdbSetDouble top Hole Flux.Scale 1.619e-19
pdbSetDouble ReflectBottom Hole Abs.Error 1.0e-8
pdbSetDouble ReflectBottom Elec Abs.Error 1.0e-8
pdbSetDouble ReflectBottom DevPsi Abs.Error 1.0e-6
pdbSetDouble ReflectBottom Hole Rel.Error 1.0e-2
pdbSetDouble ReflectBottom Elec Rel.Error 1.0e-2
pdbSetDouble ReflectBottom DevPsi Rel.Error 1.0e-2
pdbSetBoolean top Elec Fixed 1
pdbSetBoolean top Hole Fixed 1
pdbSetBoolean top DevPsi Fixed 1
pdbSetBoolean top Elec Flux 1
pdbSetBoolean top Hole Flux 1
pdbSetBoolean top DevPsi Flux 1
pdbSetString top Elec Equation {Doping - Elec + Hole}
pdbSetString top Hole Equation {DevPsi + 0.025*log((Hole+1.0e-10)/1.0e10) + top}
pdbSetString top DevPsi Equation {DevPsi - 0.025*log((Elec+1.0e-10)/1.0e10) + top}
pdbSetBoolean ReflectBottom Elec Fixed 1
pdbSetBoolean ReflectBottom Hole Fixed 1
pdbSetBoolean ReflectBottom DevPsi Fixed 1
pdbSetBoolean ReflectBottom Elec Flux 1
pdbSetBoolean ReflectBottom Hole Flux 1
pdbSetBoolean ReflectBottom DevPsi Flux 1
pdbSetString ReflectBottom Hole Equation "Doping - Elec + Hole"
pdbSetString ReflectBottom Elec Equation "DevPsi - 0.025*log((Elec+1.0e-10)/1.0e10)"
pdbSetString ReflectBottom DevPsi Equation "DevPsi + 0.025*log((Hole+1.0e-10)/1.0e10)"
Establish the grid and initialize
line x loc=0.0 spac=.01 tag=Top
line x loc=0.4 spac=0.01
line x loc=0.7 spac=0.01
line x loc=2.0 spac=0.05 tag=Bottom
region silicon xlo=Top xhi=Bottom
init
Create the contact
contact name=top silicon xlo=-0.1 xhi=0.1 add
contact name=top current=1.619e-19*(Hole-Elec) voltage supply=0.0
Initial guesses
sel z=1.0e20*(x<0.5)-1.0e17 name=Doping
sel z=0.5*(Doping+sqrt(Doping*Doping+4.0e20))/1.0e10 name=arg
sel z=0.025*log(arg) name=DevPsi
sel z=1.0e10*exp(DevPsi/0.025) name=Elec
sel z=1.0e10*exp(-DevPsi/0.025) name=Hole
solve
device
puts "Electron Flux [contact name=top sol=Elec flux]"
puts "Hole Flux [contact name=top sol=Hole flux]"
Plot the concentration profiles of the initial doping and electrons and holes at equilibrium
sel z=log10(abs(Doping))
plot.1d
sel z=log10(Elec)
plot.1d !cle
sel z=log10(Hole)
plot.1d !cle
initialize an array, bias (Vb) and counter (i), and create and new graph window
array set curr {}
set Vb 0.0
set Win [CreateGraphWindow]
set i 1
For loop that plots the IV curve of the diode in forward bias from 0V to 1.2V
for {set Vb 0.0} {$Vb < 1.2} {set Vb [expr $Vb+0.05]} {
   contact name=top supply = $Vb
set Vbias($i) $Vb
device init
set curr($i) [expr ([contact name=top sol=Elec flux] - [contact name=top sol=Hole flux])]
plot.1d !cle
AddtoLine $Win IV $Vb $curr($i)
incr i
}
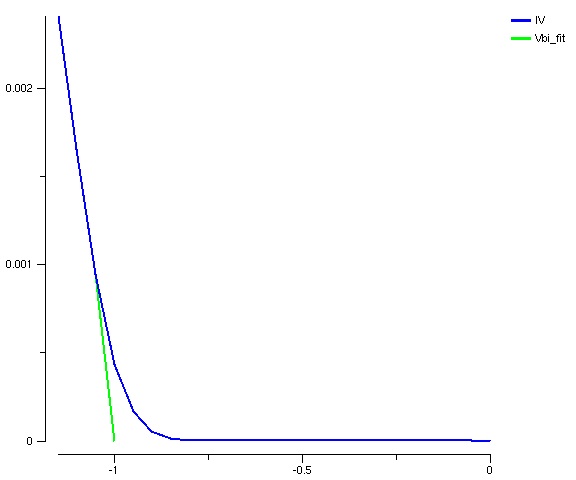
Get the last few points on the IV curve to use for linear extrapolation of the built-in voltage
set l [list "$Vbias(24)" "$curr(24)" "$Vbias(23)" "$curr(23)" "$Vbias(22)" "$curr(22)" ]
Fit the data points with "Bestline". The output will give the x-intercept or built-in voltage
Bestline $l
Create a "fit" line to plot on top of IV curve using the data points and "Bestline" x-intercept result
set line [list "$Vbias(24)" "$curr(24)" "$Vbias(23)" "$curr(23)" "$Vbias(22)" "$curr(22)" 0.9998 0]
CreateSingleLine  $Win Vbi_fit $line
The output IV plot with built-in voltage equal to 0.9998. The built in voltage calculated by the equation Vbi=Vt*ln((Nd*Na)/ni^2) is 0.9786.
