AlGaN Radiation Examples: Difference between revisions
| Line 5: | Line 5: | ||
[[File:1-1.png|600px]] | [[File:1-1.png|600px]] | ||
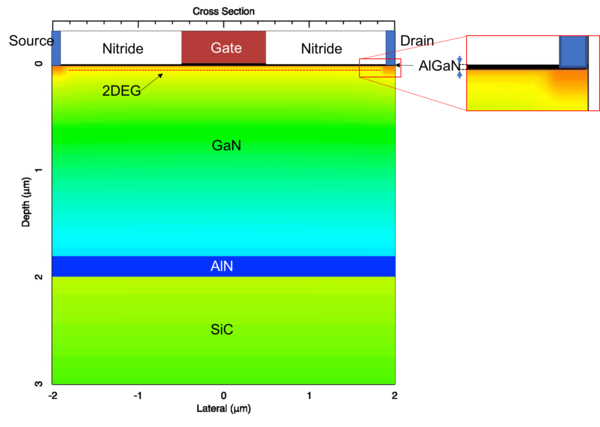
''Figure 1. A symmetric GaN-based HEMT structure with 2DEG formation at the heterostrcture interface.'' | |||
'''Steady-State Simulation''' | '''Steady-State Simulation''' | ||
| Line 12: | Line 13: | ||
[[File:4-3A.png|600px]] [[File:4-3B.png|600px]] | [[File:4-3A.png|600px]] [[File:4-3B.png|600px]] | ||
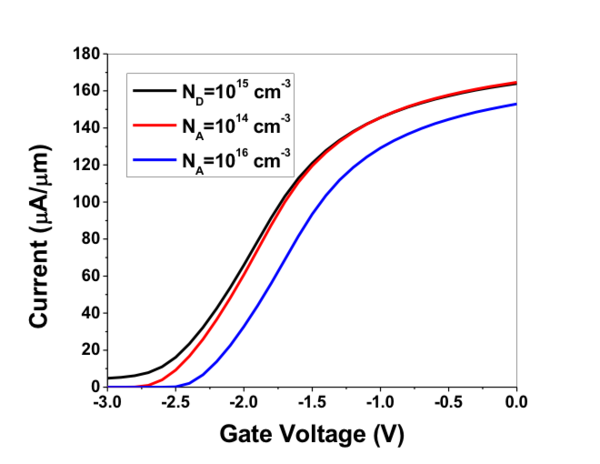
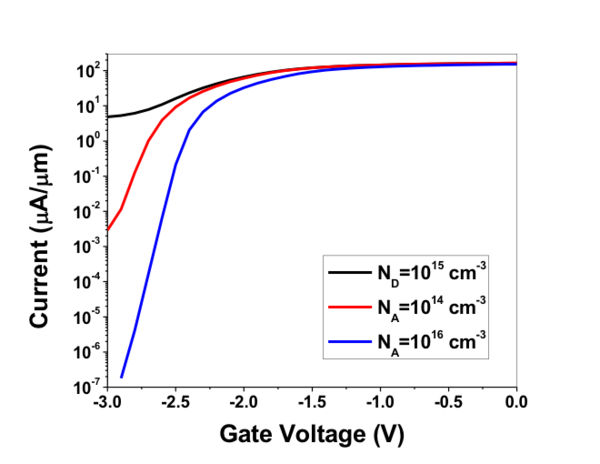
''Figure 2. Id-Vd characteristics of HEMT with varying uniform background doping(net acceptor NA and net donor ND) of the GaN buffer.'' | |||
[[File:4-4.png]] | [[File:4-4.png]] | ||
''Figure 3. Background electron concentration of the GaN corresponding to above values. Net donor charge shows possible substrate leakage path which degrades subthreshold behavior indicated in Figure 2.'' | |||
[[File:hemt.txt]] | [[File:hemt.txt]] | ||
| Line 25: | Line 30: | ||
---- | ---- | ||
[[File:5-3.png|600px]] | [[File:5-3.png|600px]] | ||
[[File:5-4.png|600px]] | [[File:5-4.png|600px]] | ||
[[File:5-6.png|600px]] | [[File:5-6.png|600px]] | ||
[[File:5-8_new.png|600px]] | [[File:5-8_new.png|600px]] | ||
Revision as of 22:27, 23 December 2017
AlGaN/GaN HEMT DC, RF and transient simulation
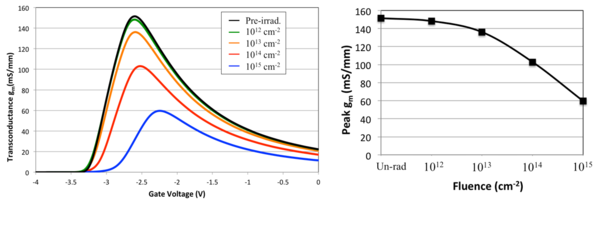
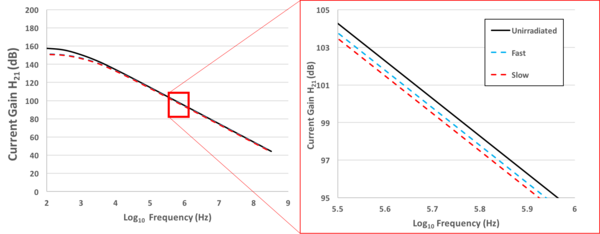
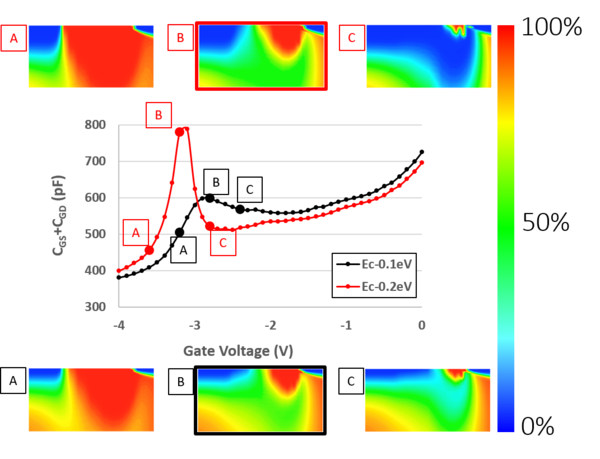
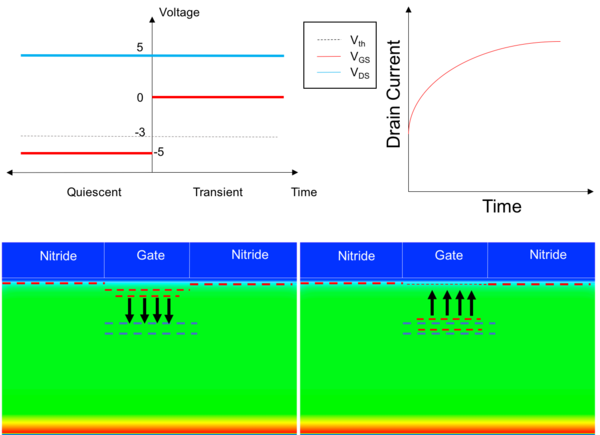
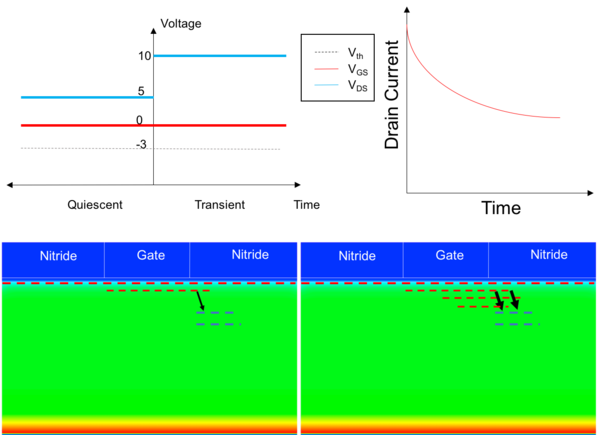
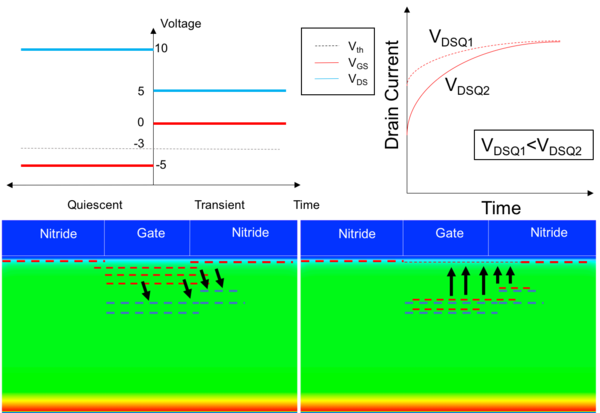
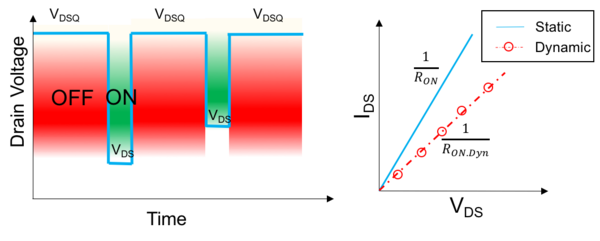
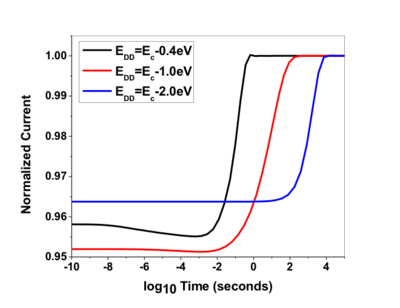
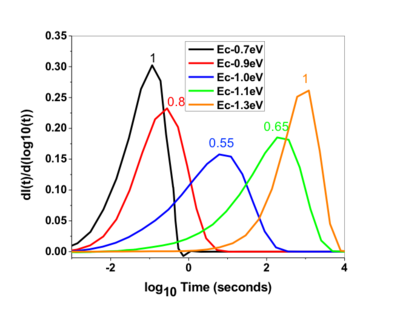
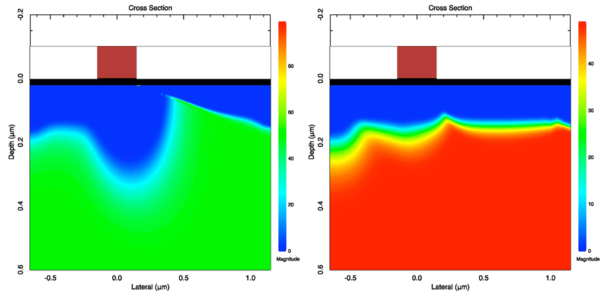
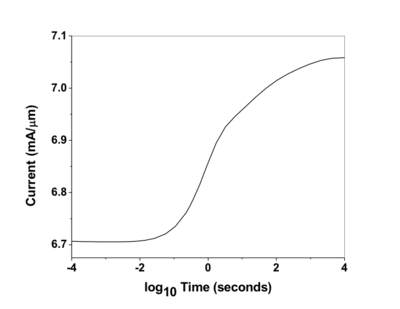
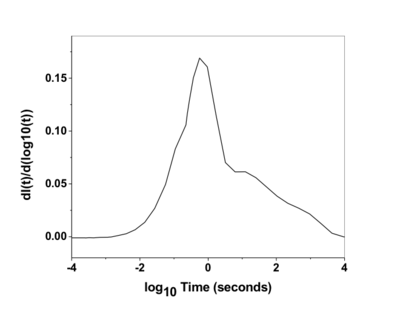
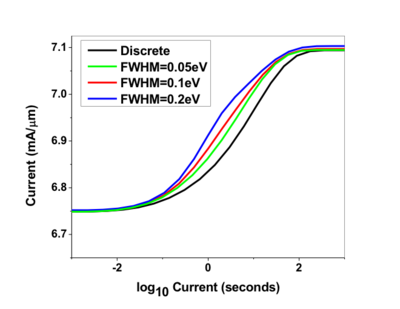
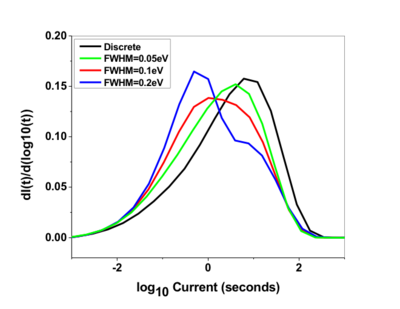
Simulation of steady-state, small-signal and transient performance to understand impact of proton-radiation induced and as-grown defects will be discussed here. Fundamental effects of buffer background doping on steady-state behavior is first discussed as it is a prerequisite to understanding published radiation induced static behavior degradation. The potential impact of proton-irradiation damage on RF performance parameters is then discussed based on small-signal analysis simulations. Section on transient simulation focuses on motivation of various switching experiments used to determine trapping by as-grown defects, and how this has been achieved using FLOODS.
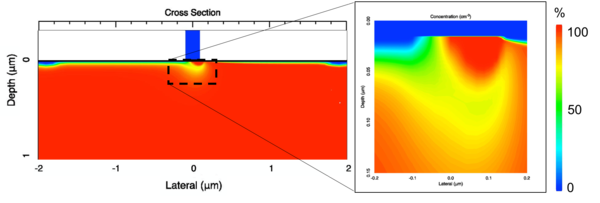
Figure 1. A symmetric GaN-based HEMT structure with 2DEG formation at the heterostrcture interface.
Steady-State Simulation
Figure 2. Id-Vd characteristics of HEMT with varying uniform background doping(net acceptor NA and net donor ND) of the GaN buffer.
Figure 3. Background electron concentration of the GaN corresponding to above values. Net donor charge shows possible substrate leakage path which degrades subthreshold behavior indicated in Figure 2.
File:Hemt.txt File:Modelfile.txt File:Poisson.txt File:Continuity.txt
Sinusoidal Steady State Analysis
File:Hemt.txt File:Continuity.txt
Transient Simulation
