AlGaN Radiation Examples: Difference between revisions
| (2 intermediate revisions by the same user not shown) | |||
| Line 20: | Line 20: | ||
''Figure 3. Background electron concentration of the GaN corresponding to above values. Net donor charge shows possible substrate leakage path which degrades subthreshold behavior indicated in Figure 2.'' | ''Figure 3. Background electron concentration of the GaN corresponding to above values. Net donor charge shows possible substrate leakage path which degrades subthreshold behavior indicated in Figure 2.'' | ||
[[File: | [[File:hemt_ss.pdf]] | ||
[[File: | [[File:Modelfile_ss.pdf]] | ||
[[File: | [[File:Poisson_ss.pdf]] | ||
[[File: | [[File:Continuity_ss.pdf]] | ||
| Line 36: | Line 36: | ||
[[File:5-4.png|600px]] | [[File:5-4.png|600px]] | ||
''Figure 5. Relatively shallow donor trap occupancy indicate presence of defects at Fermi-level (50% occupancy - | ''Figure 5. Relatively shallow donor trap occupancy indicate presence of defects at Fermi-level (50% occupancy - green) which will contribute to S3A results.'' | ||
| Line 49: | Line 49: | ||
[[File: | [[File:hemt_ac.pdf]] | ||
[[File: | [[File:Continuity_ac.pdf]] | ||
'''Transient Simulation''' | '''Transient Simulation''' | ||
| Line 90: | Line 90: | ||
[[File: | [[File:hemt_trans.pdf]] | ||
[[File: | [[File:Continuity_trans.pdf]] | ||
Latest revision as of 19:36, 10 October 2020
AlGaN/GaN HEMT DC, RF and transient simulation
Simulation of steady-state, small-signal and transient performance to understand impact of proton-radiation induced and as-grown defects will be discussed here. Fundamental effects of buffer background doping on steady-state behavior is first discussed as it is a prerequisite to understanding published radiation induced static behavior degradation. The potential impact of proton-irradiation damage on RF performance parameters is then discussed based on small-signal analysis simulations. Section on transient simulation focuses on motivation of various switching experiments used to determine trapping by as-grown defects, and how this has been achieved using FLOODS.
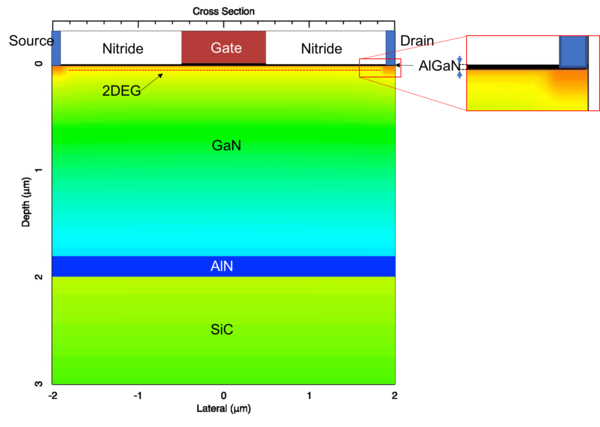
Figure 1. A symmetric GaN-based HEMT structure with 2DEG formation at the heterostrcture interface.
Steady-State Simulation
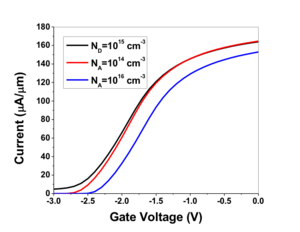
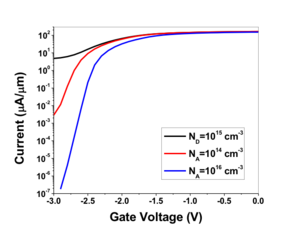
Figure 2. Id-Vd characteristics of HEMT with varying uniform background doping(net acceptor NA and net donor ND) of the GaN buffer.
Figure 3. Background electron concentration of the GaN corresponding to above values. Net donor charge shows possible substrate leakage path which degrades subthreshold behavior indicated in Figure 2.
File:Hemt ss.pdf File:Modelfile ss.pdf File:Poisson ss.pdf File:Continuity ss.pdf
Sinusoidal Steady State Analysis
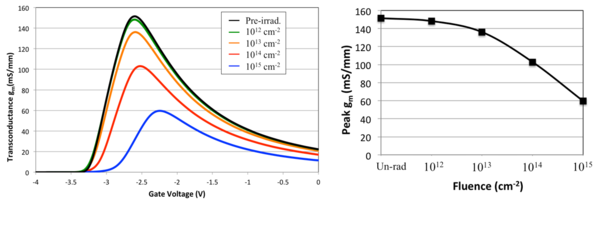
Figure 4. Transconductance degradation under increasing proton fluence as simulated by S3A technique (at 10 Hz). Results show qualitative agreement with experimental results.
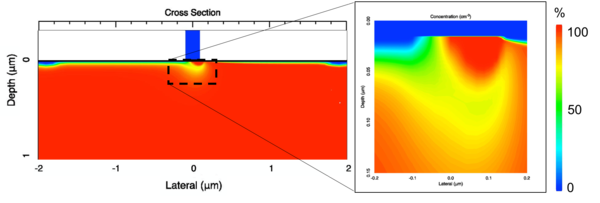
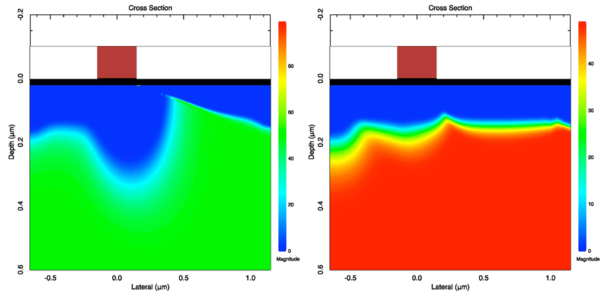
Figure 5. Relatively shallow donor trap occupancy indicate presence of defects at Fermi-level (50% occupancy - green) which will contribute to S3A results.
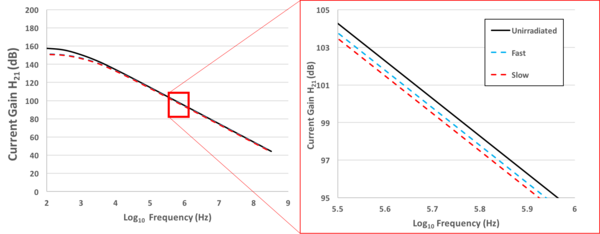
Figure 6. Frequency dependence of current gain indicating influence of trapping time constant but not significant enough contribution to the degradation. Also, linear extrapolation from low frequencies will suffice.
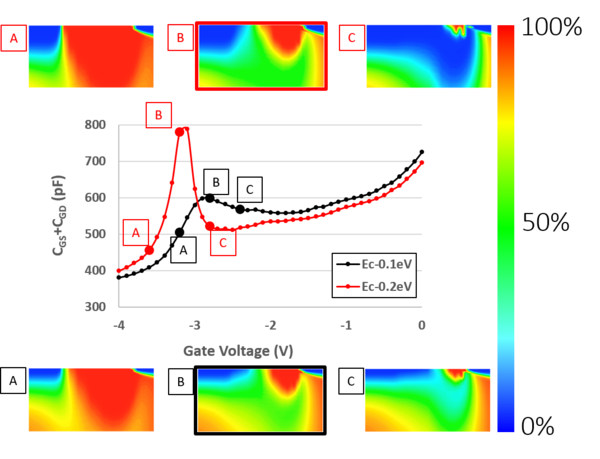
Figure 7. Variation in parasitic capacitance responsible for RF performance degradation with relatively shallow donors at different trap levels. Higher capacitance correlates to greater degradation in current gain.
File:Hemt ac.pdf
File:Continuity ac.pdf
Transient Simulation
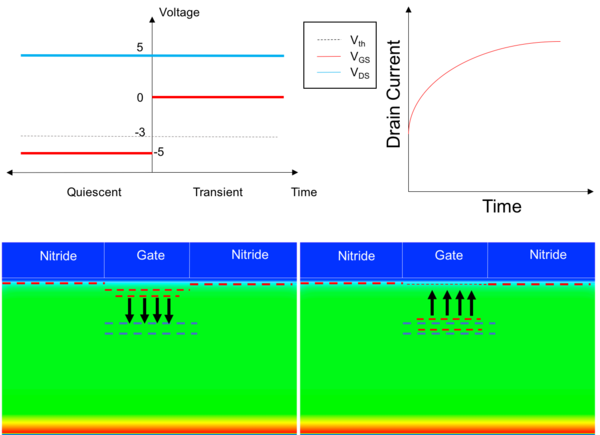
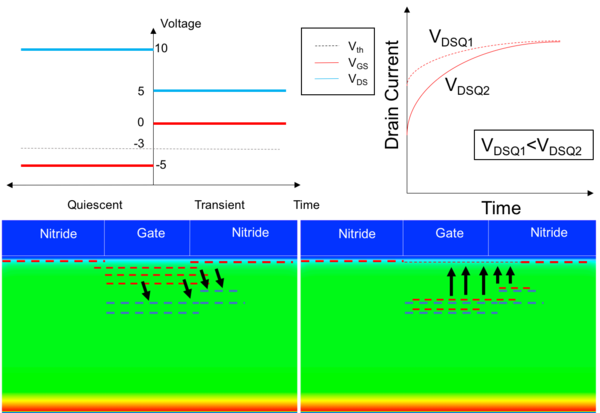
Figure 8. Gate bias switching carried out in gate-lag experiments. 2DEG electrons are expected to be trapped directly underneath the gate.
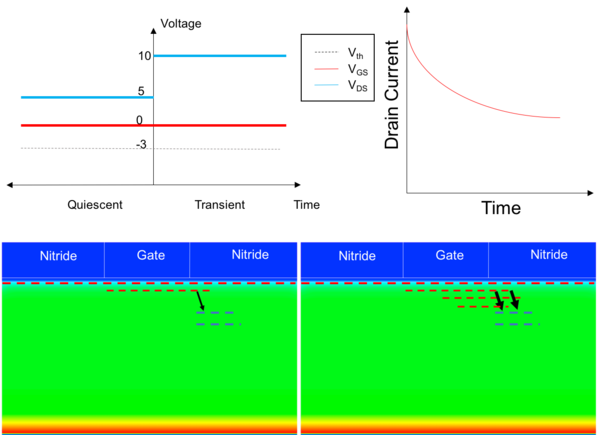
Figure 9. Drain bias switching carried out in drain-lag experiments. In low-to-high switching experiments, 2DEG electrons are injected deeper into the buffer near the drain edge giving rise to a decay in the drain current.
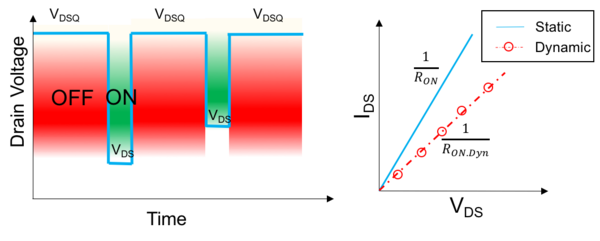
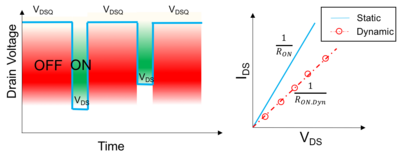
Figure 10. Simultaneous switching of drain and gate typically carried out in dynamic I-V extraction. Participating traps include both underneath the gate and near the drain edge. Higher drain bias during quiescent pulse results in greater 2DEG depletion, and increasing drain pulses during transient sampling phase is used to extract dynamic I-V.
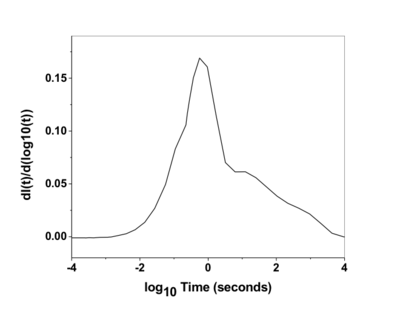
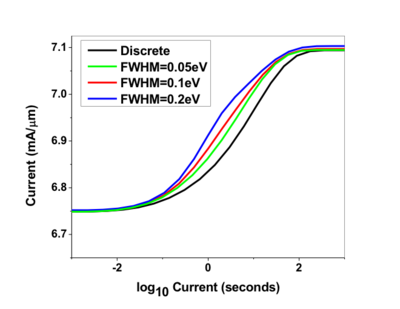
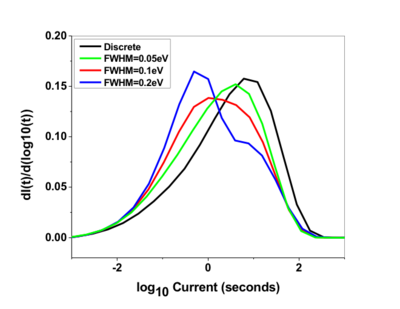
Figure 11. Three-level compensation model with deep donor level contributing to transient behavior. Multi-level and Gaussian distribution variants have also been implemented in FLOODS.
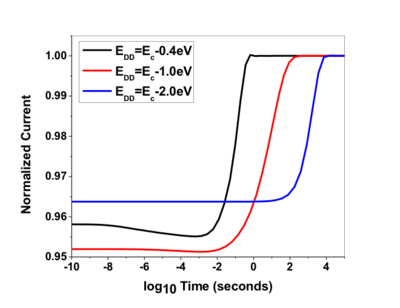
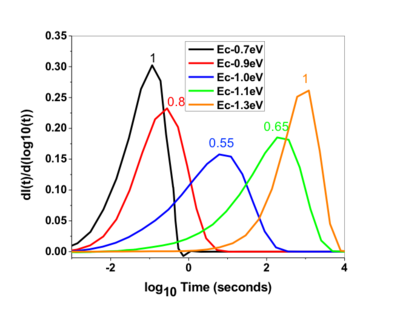
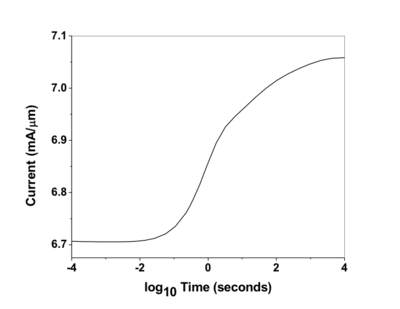
Figure 12. .
Figure 13. .
Figure 14. .
Figure 15. .
